How will the new PV safeguard tariffs affect my company?
March 28, 2020
By Debbie Sandor, CEMAC Project Leader
Like most policy questions, it depends on who you ask. Does your company manufacture crystalline silicon (c-Si) PV modules domestically or outside the United States? Does it produce polysilicon for export? Or does it focus on photovoltaic (PV) module installation? And what if your company manufactures cadmium telluride (CdTe) or other types of PV modules and cells? These are just a handful of the stakeholder perspectives the U.S. International Trade Commission (USITC) considered as it evaluated the need and developed recommendations for the new tariffs.
The new safeguard tariffs focus on imports of c-Si PV cells and modules [1] and are intended to improve the competitiveness of domestic PV module and cell manufacturing. But PV modules and cells represent just two of the many links in the manufacturing supply chain. C-Si PV module manufacturing is a complex global enterprise, with extensive trade supporting the geographical distribution of production and demand across all of the links in the supply chain—from raw materials extraction and processing, to component and subcomponent manufacture, to final end product fabrication—shown in Figure 1.
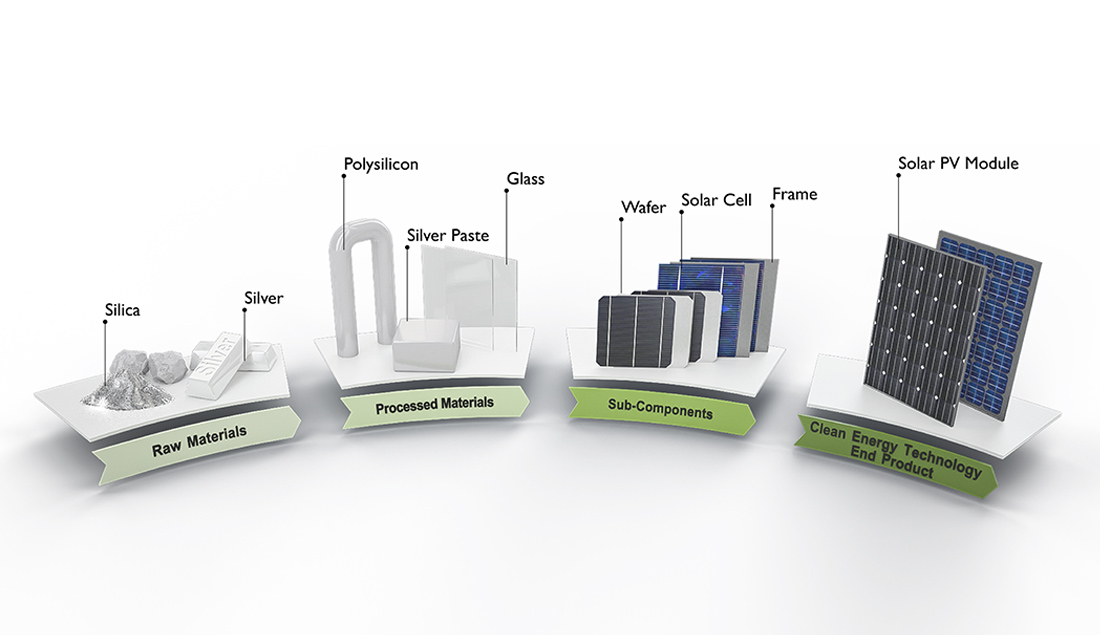
Figure 1. The c-Si PV module manufacturing supply chain. Key supply chain intermediates are highlighted. Figure from [2].
The trade flows and balance of trade for the PV module manufacturing supply chain—PV modules, cells, and polysilicon—for the top 12 clean energy manufacturing economies are shown in Figure 2. This figure illustrates how countries that may be net importers of end products may be net exporters of upstream materials and subcomponents. For example, while major PV deployment markets such as the United States and Germany are net importers for PV modules, they are also major net exporters of polysilicon to make those modules, purchased largely by Japan and China [3]. The data in Figure 2 will be further analyzed in our forthcoming update to Benchmarks of Global Clean Energy Manufacturing, which will highlight key economic, market, and trade trends between 2014-2016 for wind turbines, LEDs, and lithium-ion battery cells, in addition to c-Si PV modules.
Figure 2. Balance of trade for PV modules, cells, and polysilicon in 2016. Imports are shown as negative values and exports are shown as positive values, US$ millions. The numerical value is the balance of trade (exports less imports). From [4].
Given the extensive global supply chain network along with the potential for unintended impacts, similar to those associated with past safeguard tariff actions in other industries [5, 6, 7], the new tariffs are likely to have a ripple effect across the broader PV industry value chain—from project development and upstream polysilicon production through PV module installation and system operation (see Figure 3). These ripple effects could include shifts in the location of production facilities, retaliatory policy action from trading partners, or reduced investment in the solar PV industry to name a few [8, 9].
Figure 3. Clean energy technology value chain and manufacturing supply chain for c-Si PV modules. The 2020 safeguard tariff is focused on PV cells and modules; it does not include PV wafers or polysilicon. From [2].
But teasing out the direct impacts of tariffs on the solar PV industry from either a global or domestic perspective is challenging because tariffs aren't the only thing that impact PV technology deployment, manufacturing, and trade. Many other factors—such as currency rate fluctuations, interest rates, government incentives for building manufacturing facilities or producing renewable electricity, excesses or shortages of supply chain intermediates (over- or under-capacity situations), sharp increases in demand, and technology advancements (e.g. to reduce the amount of polysilicon needed for each PV module)—also influence the dynamics of the PV module value chain.
As a first step, CEMAC analysts recently developed a system dynamics model to provide insight into the impact of tariffs and other similar disruptions on solar-grade polysilicon manufacturing and trade [3]. This model establishes a flexible framework that can be expanded to provide insights into the longer-term dynamic impacts of disruptions—such as targeted tariffs, shifts in regional demand and production, and overcapacity—on PV module manufacturing and trade across the entire supply chain. Results from an expanded model could be used to help identify levers and actions to strengthen domestic competiveness of the PV industry. The model framework, methodology and initial results were published in Sustainability: "System Dynamics of Polysilicon for Solar Photovoltaics: A Framework for Investigating the Energy Security of Renewable Energy Supply Chains."
As you can see "How will the new PV safeguard tariffs affect my company?" is not a simple question. While the answer may always be influenced by your perspective, we will better understand the costs and benefits of the PV safeguard tariffs as analysts assess the changes in domestic demand and production, jobs and wages, prices, imports and exports, and other key metrics for each link in the PV module value chain over time.
References
- Office of the United States Trade Representative. 2020. Section 201 Cases: Imported Large Residential Washing Machines and Imported Solar Cells and Modules. Office of the United States Trade Representative. Fact Sheet. https://ustr.gov/sites/default/files/files/Press/fs/201%20FactSheet.pdf
- Sandor, D.; Chung, D.; Keyser, D.; Mann, M.; Engel-Cox, J. Benchmarks of Global Clean Energy Manufacturing; Clean Energy Manufacturing Analysis Center: Golden, CO, USA, 2017; NREL/TP-6A50-65619 https://www.nrel.gov/docs/fy17osti/65619.pdf
- Sandor, D.; Fulton, S.; Engel-Cox, J.; Peck, C.; Peterson, S. System Dynamics of Polysilicon for Solar Photovoltaics: A Framework for Investigating the Energy Security of Renewable Energy Supply Chains. Sustainability 2020, 10(1), 160; www.mdpi.com/2071-1050/10/1/160
- Ibid.
- Ryan, D. 2013. The Effects of Section 201 Safeguards on U.S. Industries. Georgetown Journal of International Law. Practitioner Commentary. Vol. 44, Issue 1.
- Francois, J. and L. M. Baughman. 2003. The Unintended Consequences of U.S. Steel Import Tariffs: A Quantification of the Impact During 2002. Trade Partnerships, LLC. http://www.tradepartnership.com/pdf_files/2002jobstudy.pdf
- Priestley, M. 2003. The Effects of the US Steel Tariffs on Australian Steel Exports to the US. Parliament of Australia Economics, Commerce and Industrial Relations Group. Research Paper no. 9 2002-2003. https://www.aph.gov.au/About_Parliament/Parliamentary_Departments/Parliamentary_Library/pubs/rp/rp0203/03RP09
- Cimino, C.; Hufbauer, G. Trade Remedies in Renewable Energy: A Global Survey. In Proceedings of China, the West, and the Challenge of Alternative Energy Innovation Workshop, Washington, DC, USA 26 June 2014; Peter, G., Ed.; Peterson Institute for International Economics: Washington, DC, USA, 2014. Available online: (15 July 2017).
- OECD (Organization for Economic Cooperation and Development). Overcoming Barriers to International Investment in Clean Energy; OECD Publishing: Paris, France, 2015; doi:10.1787/9789264227064-en.